
COVID-19 and Where We Are Now
(Data Chart links updated with March 3, 2023, data are posted at the end of this narrative.)
July 11, 2023
This last entry will close the COVID-19 Blog that was maintained by STS Studios during the past three years of the COVID pandemic. An apology might seem appropriate for the tardy closure of these ruminations but would strike me as disingenuous. Let me explain.
First, families and friends have suffered the loss of over 1 million loved ones during the pandemic. Allowing for a deliberate and unrushed pandemic demobilization perhaps lends a degree of respect for those losses.
But there are also reasons to celebrate. As we enjoy the return of certain simple freedoms – grocery shopping, face to face visits with neighbors, coworkers and friends, group outings – doing so incrementally is only prudent. Many have experienced an epiphany that such mundane activities actually constitute an enormous part of what brings joy to each day, and perhaps such reminders deserve time to soak in.
The pandemic has highlighted the fact that we are an integral part of a biome – an ecosystem of plants, animals, fungi, archaea, bacteria, viruses and even tiny fragments of genetic materials with names like “plasmids” and “bacteriophages.” This biological soup is constantly churning and intimately mixing, even to the point that it is difficult to know where one “organism” begins and the other ends. The emergence of new members of this biological universe is the very reason for its existence in the first place. The COVID-19 pandemic was just one manifestation of this ongoing commotion and is a phenomenon that has always been and will continue to be underway. As such, it seems somewhat frivolous, if not pretentious, to declare the COVID Pandemic to be “over.” Perhaps we are turning a page on this chapter, but the book continues to be written and this fact is perhaps the most important lesson we can offer to future generations.
On a more practical level, however, innumerable scientists, clinicians, emergency workers, and unnamed support workers have heroically responded to the emergence of the agent of COVID-19 (SARS-CoV-2) to do battle. A victory of sorts can now be declared. Through the development and deployment of COVID vaccines, the development of effective antiviral medications and the work of the immune systems of over 1 billion people on the planet who were naturally infected by the virus during the pandemic, herd immunity has been approximated and treatments made available in many parts of the world. As a result, the daily death toll of COVID-19 in those countries has now dropped to near the levels of influenza infections during influenza season.
It was anticipated at the beginning of this blog in March 2020 that certain racial groups and the less affluent would likely suffer the greatest morbidity and mortality rates from the unfolding pandemic. In retrospect we can see that this disparity did indeed occur, with fatality rates highest among African American and Native American populations in the U.S. (https://www.cdc.gov/coronavirus/2019-ncov/covid-data/investigations-discovery/hospitalization-death-by-race-ethnicity.html) and in communities of lower socioeconomic status (https://doi.org/10.1093/ije/dyab267 ). Interestingly, a trend towards narrowing of the racial disparity and a widening of the socioeconomic disparity over the three years of the pandemic is also reflected in the data. The reasons for such trends will continue to be analyzed for years to come, lessons learned and hopefully mitigations implemented in our efforts towards achieving health equity in this country.
Worldwide health equity is another matter, and perhaps the primary revelation of the pandemic should be that there is no “us” and “them” when it comes to the human family. Whether considering the spread of infectious disease, climate change, or hunger and education, nationality or location on the globe does not excuse us from familial responsibilities. The consequences of ignoring those responsibilities will inevitably return to our own doorsteps.
As part of these ongoing efforts, we close this blog with a sincere plea for those in the health care and educational sectors to come together with an open-eyed effort to improve public health literacy in the general population. We must elevate public understanding of basic principles of public health if we can expect to respond with greater resilience to future pandemics and ongoing health challenges. Only in this way can we build a stronger, healthier and more productive world.
January 9, 2023
If you have a moment and are interested in how colleagues working in public health and education might work together to improve public health literacy, perhaps you would get a kick out of this recent post: https://sts-studios.com/public_health-environment-prevention/how-not-to-bore-primary-students-learning-epidemiology/
July 13, 2022
As unrelenting waves of the SARS-CoV-2 pandemic continue to wash through the population with greater or lesser effects, public health systems throughout the world continue to monitor data and share recommendations, laboratories continue to analyze the ephemeral genetic sequences of new variants and sub-variants and bioengineers continue to seek updated treatments and vaccines to target immuno-evasive maneuvers by the virus to dodge the protections afforded by current vaccine-based and natural immunity. Paying attention to the incidence and impact of COVID in your community and adhering to local public health recommendations regarding masking, social distancing and, of course, vaccination continues to be the most prudent way to avoid health complications for each of us and our communities.
Monkeypox
In the meantime, we find a newly emerging monkeypox virus – a member of the orthopoxvirus genus which also includes cowpox, smallpox and vaccinia viruses – is spreading around the world primarily via contact transmission. The fatality rate for the monkeypox virus appears to be less than 10%, although research is ongoing and (as mentioned during the early course of the COVID pandemic) early estimates are notoriously unreliable when a new lineage of infectious agent emerges. Infectious agents are typically classified into three transmissibility categories based upon the environmental fragility and transmissibility of the agent:
- Contact transmission is represented by the Staphlococcus bacteria, which can be transmitted by direct contact and is most well-known for causing wound infections. Sexually transmitted diseases are usually considered a special subcategory of contact transmissible diseases.
- Droplet transmission is represented by influenza, and is an infectious agent transmitted by large droplets of moisture larger than 5 microns in size, such as are generated by a sneeze or accumulated in a tissue. Droplet transmitted diseases are also transmissible by contact, such as by sharing a drinking glass. Because some cases of the current strain of monkeypox have apparently been transmitted by droplets, this is the category in which the monkeypox virus currently can be classified, although as noted above the large majority of cases are transmitted by direct contact.
- Aerosol transmission is represented by SARS-CoV-2 and measles. Aerosol transmissible diseases can be transmitted across rooms through tiny droplets or dust particles less than 3 microns in diameter that can stay suspended in air for distances.
“Jynneos” is a vaccine that is FDA licensed for prevention of smallpox and monkeypox in people over 18 years old. Preventive vaccination (“Post-Exposure Prophylaxis” or “PEP”) with Jynneos can be considered for people who have had a high- or intermediate-risk exposure to monkeypox (see CDC guidance), as a method to prevent or reduce severity of disease. Post-exposure prophylaxis should be given, if possible, within 4 days of exposure to prevent monkeypox disease.
The emergence of monkeypox serves as a reminder that the SARS-CoV-2 pandemic is not an isolated anomalous event, but rather a branch of the endless and ongoing process of biological evolution which makes up the living soup within which we exist. One might expect that a deep understanding of this fact would inspire each person to take measures to maximize their advantages, their families’ advantages and the advantages of their communities within this soup. It remains the purpose of this website to shed light upon information that might better equip each person to take on this effort.
COVID-19
Reviewing recent developments in the SARS-CoV-2 pandemic, the currently predominant COVID virus spreading throughout the U.S. is the BA.5 subvariant. As research continues to seek an updated vaccine that is less susceptible to being dodged by new mutations of the latest subvariant, higher risk patients are being treated with a combination of antivirals, nirmatrelvir/ritonavir (brand name “Paxlovid”), to decrease case-hospitalization and mortality rates. Treatment typically consists of taking both antiviral medications twice daily for five days, and certain drug interactions should be reviewed with your treating caregiver if you are taking other medications.
January 4, 2022
Visitors to these notes on the SARS-CoV-2 pandemic may wonder why there has been no recent entry, particularly since the omicron variant has emerged and is now responsible for causing case numbers to skyrocket to higher heights than at any previous point in the pandemic. There are many reasons that I could list, although the simplest that occurs to me at this moment is that my attention has been diverted by domestic chores and family responsibilities. Another reason is that the emergence of the omicron variant is exactly what had been repeatedly foretold in these narratives, the dynamic nature of viral emergence, ongoing evolution and spread having been cited as the most urgent reason why we should wear masks in public settings and isolate ourselves if we become ill, and why all people who qualify to receive an authorized COVID vaccine should seek vaccination. Nothing has changed about these clear science-based recommendations. Finally, honesty requires that I add fatigue as another reason why there has been no recent update to these ramblings. However, after having engaged in chats with other science-minded colleagues over the holidays, several ruminations emerged that I hope are worth sharing.
First, what are the most salient points about omicron? As supported by the graphs at the end of this narrative, data currently indicates that the new omicron variant is significantly more transmissible. In fact, charts showing the four-fold increase in new cases over the prior 24 hours at first view may be somewhat alarming. This means that this newly revised virus either requires a smaller number of viruses to be infectious (smaller “infectious dose”), or that infected people shed a larger number of viruses (higher “viral load”), or for infections to be less symptomatic resulting in inadvertent spread, or the new virus is more stable in the environment, or the virus more efficiently binds to the receptor in our respiratory system cells that allows it entry into our cells, or some other newly revised mechanism has allowed the virus’s reproduction number to go up. Remember from earlier in this narrative that the “reproduction number” is the number of other people ultimately infected by a single person with an infection. The reproduction number of the omicron SARS-CoV-2 variant has been estimated at about three times that of the previous delta variant at the time of the emergence of omicron, explaining the nearly four-fold increase in new cases shown on the graphs.
The good news is that the omicron variant appears to be significantly less lethal, at least at the present time. Hospitalization rates are lower and deaths in people hospitalized are lower for the omicron variant than for earlier versions of the virus.[1] Of course, this is at least partially explained by the availability of monoclonal antibody and antiviral treatments that have been developed and are now being more widely implemented. It is also likely influenced by the partial protection against severe disease afforded those vaccinated people with breakthrough infections, recognizing that it is still true that a two- to four-fold higher number of unvaccinated people are suffering infection than vaccinated people. But infection with the omicron variant still appears to be less severe, despite these factors that muddy the data analysis.
What does this suggest the future holds? As we gather a greater understanding of the capacity of this virus to continue its inevitable evolution, there may be a time when SARS-CoV-2 will become much more like influenza, a virus that coexists among us, causing frequent infections but resulting in a relatively small number of serious illnesses, hospitalizations and deaths. At such a time, there may be good reason to relax interventions like travel restrictions, mandatory vaccines, school closures during small outbreaks and masking in public settings. From my view, with an average of 1000 deaths per day in the U.S., this point has certainly not yet been reached.
Another possibility is that a new, more effective vaccine (and/or vaccine regimen) will be developed that is less susceptible to diminishing immunity over time, in which case COVID illness will more closely imitate the trajectory of maladies like Hemophilus influenza Type B for which the HIB vaccine was introduced in the 1990s. The use of the HIB vaccine for infants resulted in the virtual disappearance of HIB meningitis in young children over the last 25 years, a disease that previously killed about 1000 infants each year.
An alternative future might be that the virus mutates to cause more severe illness and higher case fatality rates. It is important to consider that there is an intricate balance between lethality and transmissability of an infectious agent when considering which is more advantageous to the spread of the agent. In the case of viruses like ebola, its capacity to cause severe hemorrhage (bleeding) contributed both to its capacity to spread through exposure to the blood of an infected person and to a higher case fatality rate (lethality) for the infected individual. But it is worth noting that there is a selective advantage to viruses that lead to extended, mild infection over longer periods of time (like the HIV virus) to allow for a longer infectious period to increase transmission rates (and therefore further spread of the virus). This implies that there is a selective advantage for viruses to be less lethal. But this selective advantage for lower lethality may be overridden by the development of a mode of transmission that is so effective that spread of the virus is made more efficient. Examples of this are listed in the first paragraph above, but also might include causing more severe coughing in a respiratory virus, or more severe diarrhea and/or vomitting for a virus that causes gastrointestinal disease.
The important notion to keep in mind as we contemplate our responsibilities is that no living organism is static. Life itself can be defined by its capacity to reproduce and undergo incremental changes in the process. As such, organisms never reach an endpoint, unless they vanish completely. Even then, there is always the potential for an extinct organism to reappear, if only as an equivalent replica, through a parallel or convergent evolutionary process. Herein lies our responsibility to maximize the chance that this constant state of flux results in minimal suffering and maximal opportunity for ourselves, our families and our communities.
Please get vaccinated if you are a candidate for vaccination, wear a mask if in a public setting, stay home and test if you are ill. As we learn more about this foe in the future, we may be able to relax our precautions, but for now we must remain vigilant and listen to public health experts.
[1] Maslo, C et al Characteristics and Outcomes of Hospitalized Patients in South Africa During the COVID-19 Omicron Wave Compared With Previous Waves JAMA Research Letter December 30, 2021. https://doi.org/10.1001/jama.2021.24868
November 19, 2021
Three new developments in our ramparts against SARS-CoV-2 include 1) the authorization in the U.S. for booster doses of the authorized vaccines (for convenience, referred to here as the Pfizer, Moderna and Johnson&Johnson [J&J] vaccines) for individuals who have completed the primary vaccination series for their respected vaccine, 2) the authorization for 5 to 11 year olds to receive a primary series of the Pfizer vaccine, and 3) early evidence of another wave of infection affecting Europe, China and Russia, and now some suggestion of the same in the U.S.
A couple of quick blurbs regarding the first and second developments. Booster doses of vaccine can be with a different vaccine than the one under which the primary series was obtained. This is the so-called “mix-and-match” approval, meaning that a person is not restricted to receive a booster dose with the same vaccine that was previously used in the primary series. The booster dose of the Moderna is one-half of the primary series dose, while the booster doses of the Pfizer and J&J vaccines are the same as the primary series dose. Please review the CDC recommendations at the following link for detailed guidelines and discuss questions with your care provider: CDC COVID Booster Vaccine Guidelines
Why receive a booster dose? Because immunity, not surprisingly, wanes over time. This is true for other coronaviruses and was anticipated when the vaccination efforts first were deployed at the beginning of the COVID pandemic. However, ongoing work is seeking a vaccine target and/or mechanism that will provide longer lasting protection to the individual and to the community.
In regard to the new authorization of a vaccine for 5 to 11 year olds, parents across the country are requestioning the need to vaccinate. Unfortunately, according to CDC data, only 69% of the U.S. population over 12 years of age are fully vaccinated. If the population over 5 years of age who now qualify for vaccine are included, then only 58.9% of the US population qualifying for vaccination are fully vaccinated (U.S. Vaccination Rates). While the risks posed to a 5 to 11 year old person from COVID infection is less than than the risk posed to a person 12 years or older – and significantly less than risk posed to people 60 years or older – the risk to this youthful population is not zero: there have been over 1.9 million infections in this age group, over 8,300 hospitalizations, and over 94 deaths. In addition, the contribution of the 5 to 11 year old population to the ongoing transmission and potential evolution of the virus to become a more aggressive foe is clearly significant (MMWR on the 5 to 11 yr old Population).
Which brings us to the current swells of a potential new wave of infection. To more clearly illustrate the daily reports of infection, a new graph is included at the end of this narrative which reflects the number of new infections reported in the U.S. in the past 24 hours. Whether the rise at the right end of this graph is the first sign of the onset of the next wave, or whether it reflects a bimodal receding wave will only be clear after the next few weeks. However, the current experience of significant new outbreaks occurring in Europe, China and Russia is concerning. The possibility of a new viral strain explaining this trend is under investigation, reminding us that ongoing efforts must be diligently exerted against SARS-CoV-2 before we can expect to return to pre-pandemic behavior. This means that during the holiday season in the U.S. we must continue to mask in public settings, to obey social distancing and to follow quarantine, isolation and vaccination recommendations according to public health experts and personal caregivers.
October 5, 2021
As has been the case throughout the course of the COVID-19 pandemic, recommendations from public health experts have been frequently revised in accordance with updated data. As discussed earlier in this narrative, this is perfectly in keeping with the natural recalibrations that characterize the practice of science. With this in mind, it became apparent that the June 2 and June 25 entries below have not been updated with newer recommendations from public health experts regarding masking, so this entry is simply intended to bring current recommendations regarding masking up to date.
Increased transmission has been seen over the summer due to the widely discussed Delta variant as it has become the dominant strain around the globe. In accordance with natural selection, this variant has confronted a population that now has a significant level of immunity, either through prior natural infection or through successful vaccination campaigns launched in developed countries around the world. Note that these vaccination campaigns have primarily been conducted in first-world countries where pharmaceutical companies have their homes and vaccine availability was therefore straightforward. An effort to make vaccine availability more equitable is now underway and being coordinated by the World Health Organization.
Because a certain level of immunity now confronts the virus as it spreads to new potential hosts, mutations within the viral population that allow it to escape the resistance provided by that immunity have a selective advantage, allowing newer variants to survive and infect their hosts, even some hosts who have been previously infected or who have been fully vaccinated. This is called “breakthrough infection.” Note that this is NOT an argument against the effectiveness of vaccine, any more than a bank robber who changes his or her clothing is an argument against continuing to try to apprehend the bank robber. It simply means that we need to continue to modify the tools available to us to identify and “arrest” the offending virus. Indeed, efforts are now underway, to develop updated vaccines that maximize effectiveness against the prevailing viral strain.
However, in the meantime, the public has been advised that everyone, even fully vaccinated people, should wear masks (and wear them properly, of course!) when in public settings where transmission is possible or likely. Examples include dancing indoors, flying on a plane, riding an elevator etc… Be aware that currently available vaccines continue to be very effective at preventing hospitalization and death (80 to 90% effective in most studies), but in order for the world to push the SARS-CoV-2 virus into retreat for good we must continue to work together to minimize ongoing transmission, and thereby minimize the chance for further mutations to result in the emergence of a newly aggressive or newly “disguised” (ie. the bank robber in new clothing) virus strains.
October 2, 2021
In 1910 a publication titled the Flexner Report influenced medical training in the United States and continues to exert that influence over 100 years later. This report contributed to a model of medical education for U.S. physicians in which a strong scientific foundation is established early in the curriculum, followed by a thorough first-hand clinical education leading to internship and residency training for new young physicians. This model was proposed to provide students with a sound scientific basis for clinical decision-making and critical thinking that would serve them and their patients well throughout their subsequent medical careers. This educational strategy has catapulted the reputation of medical care in the U.S. to the highest levels, at least for those who can afford access to that care. While developments in modern medicine have led to suggestions that this educational model be revisited now (https://www.ncbi.nlm.nih.gov/pmc/articles/PMC3178858/), the rationale expressed in the Flexner Report contains a valuable lesson for public education in the era of the COVID pandemic. The past year has revealed a surprising skepticism towards science on the part of significant portion of the U.S. population, contributing to the rejection of carefully considered recommendations from public health experts. The source of such skepticism continues to be explored and debated, with explanations ranging from extreme ideological and political convictions and from widespread social media mis- and disinformation campaigns, to shortcomings in health and public health literacy. It is this latter deficiency in health and public health literacy that has received little direct attention and yet offers a tangible and less controversial way to correct failures in the U.S. response to the COVID pandemic. If public education from K – 12th grade were to embrace the same strategy expressed in the Flexner Report – to prioritize basic science education as related to public health – the ability of the public to understand and appropriately respond to the challenges of future pandemics will save lives. Such an educational campaign would also address chronic health challenges like obesity and substance dependency, with further savings of lives and improvements in the quality of life. In a July 2021 essay in the New England Journal of Medicine, Dr. J. Michael McGinnis et al point out that “health is shaped by multiple forces: genetic predispositions, social circumstances, physical environments, behavioral choices, and medical care….(K)nowledge to guide those actions must derive from, and be useful to, all participants, especially the people whose health and well-being are the anchoring aim” (https://doi.org/10.1056/NEJMp2103872). Over past decades, the need for improved health literacy in this country has led to the expansion of the Office of Communication Science at the CDC and a new vocabulary that includes bewildering terms such as “patient activation,” “metacognition,” “disinformation” and a new definition of “Health Literacy” that remains under debate. Despite the chaos, one thing remains clear. Unless public education prioritizes teaching scientific principles as related to health, the U.S. will continue to be at a disadvantage when responding to future public health challenges. Those scientific principles must include a basic understanding of probability (e.g. relative vs. absolute risk), familiarity with concepts of social justice and the determinants of health, and in the personal risks of ignoring the critical relevance of community health to the health of each individual within a community, and indeed of global health to every human being on the planet.
July 17, 2021
Public Health messaging is desperately trying to encourage those who are candidates for one of the authorized COVID vaccines to step up to be vaccinated. Doing so, as has been reiterated in these narratives, will protect not only the vaccinated individual, but also their family and community. While the risks of vaccination are NOT zero, the risks of being unvaccinated or living in an undervaccinated community while SARS-CoV-2 continues to circulate is much greater. This is particularly true as the virus continues to mutate, increasing the chance that a new, more deadly, more transmissible virus might evolve, or even worse might develop a disguise that evades the immunity created by currently available vaccines. This is the science underlying the risk of being unvaccinated.
One of the strategies used to maximize the efficiency of messaging to the public on COVID vaccines is to identify the segment of the population that continues to decline vaccination. According to the Kaiser foundation, one of the factors that correlates most closely with the population that has been skeptical of the risks posed by COVID and COVID vaccination has been political party affiliation. The following chart illustrates this remarkable correlation for counties in California.
CA County Vaccination Rates as a Function of County Political Party Balance
When we make decisions about our health and the health of our communities based upon political ideology rather than the science of health and public health, we place ourselves, our families, our communities and the leadership of our country at risk.
June 25, 2021
According to a preliminary analysis of hospitalization data from May, 2021, by the Associated Press, less than 2 out of a thousand hospitalizations in the U.S. were in fully vaccinated people and less than 1% of deaths were in fully vaccinated people. The CDC has not yet conducted a similar analysis of these numbers because of limitations in the data, but it is nontheless apparent that the COVID vaccination campaign in the U.S. has enormously contributed to the containment of the COVID-19 pandemic.
June 2, 2021
As we follow the reported incidence of COVID-19 and the associated deaths, the U.S. continues to register declining rates.
There was concern that the CDC recommendation released on May 13, 2021, that fully vaccinated people no longer needed to wear a mask, might result in a widespread movement away from mask wearing, even among the unvaccinated population. While such occurrences have surely occurred, evidence from the website vaccine.gov suggests that in fact, an increase in the numbers of people seeking vaccination followed the announcement. Now, almost two weeks after the release of the recommendation, an increase in disease transmission due to widespread and inappropriate abandonment of mask-wearing does not appear to be underway. In part, this may be due to the fact that over 50% of the U.S. population has received at least one dose of vaccine against SARS-CoV-2 and almost 50% has been fully vaccinated.
Reviewing the methods employed by the public health sector to educate and inspire the U.S. population to seek COVID vaccinations we find that in some states a Pavlovian strategy was included. Ohio, New York and Maryland have announced free lottery tickets for those who receive COVID vaccinations. While connecting a behavior normally based on altruistic motives with a personal reward may undermine the altruistic quality of the act, any policy that results in a more highly vaccinated population during a pandemic makes public health sense.
The ruminations that must be running through each persons’ mind as we go about our daily routines must be complex.
- For those who are fully vaccinated and otherwise at low risk for exposure to disease, eliminating mask-wearing must be a considerable relief. On the other hand, when such persons are exposed to a population that is high risk – perhaps a group that is non-adherent to public health recommendations and UNvaccinated, or perhaps a hospitalized population or residents in a long term care facility – they may still choose to wear a mask to provide additional protection and also to model mask-wearing behavior.
- For those who are not yet vaccinated but now considering vaccination, advertisements, comments from family, friends and neighbors, advice from health care providers and media reports are likely to make the difference between action and inaction. Perhaps even a lottery ticket will provide the needed incentive. In the meantime, do they wear a mask in public or not? Hopefully so.
- For those who have medical contraindications to being vaccinated, those conditions that result in preventing them from being a vaccine candidate may also place them at high risk for complications if they were to become infected. An example might be a highly allergic person who has had multiple anaphylactic reactions to components of vaccines and who also suffers from severe immune-mediated illness like asthma. These are the people for whom the rest of the population must be vaccinated to afford them protection. These persons will also hopefully wear masks when in public settings, particularly when those settings are high risk.
- Then there are those who simply refuse vaccination without medical contraindications. Research has indicated that these people are not likely to be swayed towards vaccination by any evidence short of a personal tragedy that brings the risks of the pandemic to their own doorstep. Will these individuals wear masks when in public? Likely not. Hopefully, as COVID vaccination becomes the social norm, some of these vaccine-hesitant folks will join the effort.
March 6, 2021
As we approach one year of exploring and sharing the science of the SARS-CoV-2 outbreak, this entry shares the following Bibliography. This compilation of research includes only a subset of the 300,000 or so studies that have been published or released as pre-prints pertaining to the COVID-19 outbreak over the past year. Some of the articles describe the unfolding study of the SARS-CoV-2 virus, while other entries review prior knowledge of the transmission characteristics of other related infectious agents, and still other entries review such phenomena as aerosol dynamics and the effects of masking. The dedicated scientists and health care providers who have devoted their lives to these discoveries have worked diligently in their efforts to shed light on the COVID-19 pandemic and provide the public and our leaders with information – the “intelligence” of warfare – that has allowed us to take enormous steps towards defeating this foe.
February 24, 2021
The following link will take you to an article authored by J. Riphagen-Dalhuisen et al and published in Eurosurveillance in 2013 entitled Hospital-based cluster randomised controlled trial to assess effects of a multi-faceted programme on influenza vaccine coverage among hospital healthcare workers and nosocomial influenza in the Netherlands, 2009 to 2011. https://doi.org/10.2807/1560-7917.ES2013.18.26.20512 In this study, badges were used in conjunction with broad interventions to promote influenza vaccination among healthcare workers in the Netherlands. In the study, badges were given to vaccine recipients to wear that read, “Deliberately vaccinated for you.” The vaccination rate was 20% in the control group compared with 32% in the intervention group. Since multiple interventions were employed in the study it is impossible to know how much of the increase in the number of willing vaccine recipients resulted specifically from the badge message. Nevertheless, other studies have supported the hypothesis that promoting community responsibility and prosocial norms is an effective strategy for increasing the percent of a population willing to receive vaccinations (See Brewer, N.T. et al. Increasing Vaccination: Putting Psychological Science Into Action. Psychol Sci Public Interest. 2017 Dec;18(3):149-207. https://doi.org/10.1177/1529100618760521). With that in mind, as we face an enormous challenge to overcome COVID-19 vaccine hesitancy in our communities, the following link will allow you to download and print 8 badges on Avery Adhesive Name Badges, pattern #88395, to wear and distribute to your vaccinated friends: ShirleyVaccinationBadges.Avery88395.png
“Shirley” is a bashful syringe, mortified that people are afraid of her very approach. In fact, she works tirelessly to see that our communities are protected from disease outbreaks like COVID-19. Wear her on behalf of your community as a way to unify your community against our real foe: the SARS-CoV-2 virus.
January 21, 2021
How about some good news to start 2021? After a pervasive sense of optimism swept through the population over these past 24 hours, data displayed on the graphs that are posted at the end of this narrative show a decrease in the incidence of new COVID-19 infections in the U.S. following this most recent “third” wave of the outbreak. Note that the graphs reveal two prior falls in the incidence of new infection that occured over the past year to mark the end of the two previous waves of infection that swept through the country, but this most recent (albeit early) fall in incidence is somewhat different because it is occurring in the context of the distribution of COVID-19 vaccine. As previously, a parallel decrease in the COVID-19 death rate can be expected to follow the decrease in incidence of new infection by approximately 2 weeks. Let us all remain dilligent to continue to follow masking (now a required precaution on any federal land in accordance with the presidential order from President Biden), hand washing, physical distancing and generally prudent hygeine practices to allow the vaccine and our army of vaccinators to have a maximal impact on decreasing the spread of SARS-CoV-2 throughout our communities. And let us send comfort to those who have lost loved ones during the outbreak.
January 7, 2021
The following piece addresses the topic of public health literacy and the need for the educational and public health sectors to bring public health education into the mainstream of primary and secondary education in this country. Many of these points have been raised here previously in the context of the COVID-19 pandemic, but summarizing them now in this piece seemed timely and worthwhile. I hope they are constructive.
Public Health Literacy and the COVID-19 Challenge.1.10.2021
December 21, 2020
The Moderna mRNA vaccine received an Emergency Use Authorization this weekend. The following fact sheet will provide information about this second vaccine available in the U.S.
Moderna mRNA-1273 COVID-19 Vaccine: https://www.fda.gov/media/144638/download
December 17, 2020
The attached graphs following this narrative reveal a significant spike in deaths in California following a sharp rise in COVID-19 cases in California one to two weeks earlier. Similar recent trends have occurred across the country and around the world, although the trend in the U.S. appears to be more severe and sustained (see https://static01.nyt.com/images/2020/12/16/multimedia/16-MORNING-WORLDCASES/16-MORNING-WORLDCASES-jumbo.png?quality=90&auto=webp). Some cases are the inevitable consequence of essential workers performing important tasks like health care, personal care, emergency response, management of utilities, food production and distribution, social services, law enforcement, fire prevention, government services and military service. However, the bulk of the cases are showing up due to non-essential social activities and refusal to wear masks or adhere to public health recommendations by the general population. Other contributing factors include dense living conditions among lower socioeconomic populations, a condition aggrevated by widening economic disparity in this country. At this time, as vaccines are even now being distributed, it is critical that we spread the word to meticulously practice all recommended COVID-19 precautions so we can reap the greatest benefit from the rapid development of these vaccines. Vaccination with these vaccines is much safer than suffering the consequences of COVID-19 infection or living in a community that is not vaccinated against the virus, and in coming months every qualifying person will have an opportunity to be vaccinated. Unfortunately, many countries on the planet will not have the same level of opportunity as United States citizens, but this unequal access problem can and will be addressed as soon as world leaders recognize the global benefit of doing so and make such a commitment. Stay safe and get vaccinated when your turn comes up. The following link will provide information about the vaccine authorized for use in the U.S. as of December 17, 2020. The Moderna COVID-19 vaccine is undergoing review by the FDA Advisory Panel today.
Pfizer-BioNTech COVID-19 vaccine: https://www.cvdvaccine-us.com/images/pdf/fact-sheet-for-recipients-and-caregivers.pdf
December 1, 2020
The following link will take you to a pdf file that was prepared to help clarify some principles related to COVID-19. It turns out that Nature (capital “N”) does not operate like a light switch, immediately materializing unavoidable events. Even earthquakes build up for hundreds of thousands of years before tensions in seizmic plates lead to sudden and apparently spontaneous slippage in the form of an earthquake. Similarly, SARS-CoV-2 infection infects a person, produces more virus within that person and spreads over time to other people, creating opportunities for us to intervene to limit the spread of disease at any number of points along the cycle. In much the same way that we can prevent the spread of dandelion weeds across a lawn or empty lot, we can prevent the spread of COVID-19, as illustrated in this attached file. To prevent initial infection, we can be vaccinated against the virus. This would be like preventing a dandelion seed from germinating in the first place. Or if we become infected we can wear a mask to prevent spreading the “seeds” of infection to others, like covering the growing dandelion plant with a jar. Or if we are lucky enough to have a cure for the virus, we can illiminate the virus through treatment, similar to uprooting a growing dandelion plant before it can send its seeds floating far and wide.
The message here is that Nature is no chaotic villain. Instead, Nature operates through elegant laws that must be deliberately contravened or mitigated if we are to avoid the pitfalls created by those natural laws. While we may not be capable of altering the process of plate tectonics that leads to earthquakes, we can take steps to make buildings earthquake resistant, we can take steps to prevent the encroachment of invasive weeds into gardens and orchards and we can avoid spreading SARS-CoV-2 and COVID-19.
November 13, 2020
A surge in COVID-19 cases has continued around the world. In the U.S., the current increase in case numbers is most marked in the midwest. A recent Nature journal article (https://doi.org/10.1038/s41586-020-2923-3) identifies the settings in which most transmission events have recently occurred in 10 large U.S. metropolitan areas, identifying as high risk locations settings such as full-service restaurants, gyms, hotels, cafes, religious organizations, and limited-service restaurants which produced the largest predicted increases in infections when reopened. Epidemologic models continue to indicate that widespread use of cloth masks, limiting occupancy in specific venues (6-foot “physical distancing”), staying home from work and school when ill and cooperating with case investigations and contact tracing to the extent that health departments have the resources to complete these critical tasks are the most effective tools to combat this pandemic. Surveys indicate that large segments of the population continue to not adhere to these simple measures, contributing to the ongoing spread of SARS-CoV-2 in the U.S. Here are links to only two recent articles. https://jamanetwork.com/journals/jama/fullarticle/2771841 https://www.cdc.gov/mmwr/volumes/69/wr/pdfs/mm6941e2-H.pdf
October 18, 2020
Over the course of the past month, several reports of interest have been published. One from the New England Journal of Medicine (Gandhi, M et al Facial Masking for Covid-19 — Potential for “Variolation” as We Await a Vaccine NEJM September 8, 2020 https://doi.org/10.1056/NEJMp2026913) describes the theory that masking may provide a “low-dose inoculum” of SARS-CoV-2 that may result in less severe infection but with some immunity. The article’s authors recognize that additional research is needed before this theory gains sufficient support to result in specific public health recommendations different than the recommendations that are already in place, but in view of other research, this may have some practical applications in the future.
A second article was released in the journal Emerging Infectious Disease (Schwarzkopf, S et al Cellular Immunity in COVID-19 Convalescents with PCR-Confirmed Infection but with Undetectable SARS-CoV-2–Specific IgG, EID Vol. 27, No. 1 (Downloaded October 16, 2020) January 2021 https://wwwnc.cdc.gov/eid/article/27/1/20-3772_article) that raises the possibility that T-cell mediated immunity may play a significant role in SARS-CoV-2 prevention. As noted in a number of additional studies, humoral immunity (immunity gained by the production of antibodies to a particular organism or it’s components) appears to wane after a couple of months to the point that somewhere around 60% of COVID-19 patients lose measurable evidence of IgG or IgM antibodies to the virus after a couple months. It may be that the type of immunity that most often develops after viral infection – cell-mediated immunity mediated by T-cells – is important to the ultimate development of individual resistence to infection and therefore herd immunity in the population.
Regardless of the impressive work being done to develop tools and strategies against the COVID-19 outbreak, the current tiered approach to social distancing (at work and play), mask-use by the entire population, and hand and particularly cough hygeine remain the core principles.
October 16, 2020
In California, counties are categorized according to tiers based upon several factors reflecting the status of the COVID-19 outbreak, with different tiers qualifying for different levels of commerce and community services, but with all counties requiring the expected use of masks while in public and when unable to maintain safe distances between persons. Similarly, school reopening hinges upon the county tier classification and the specific decisions of local educational and public health leaders in consultation with their communities. As might be expected, details are consistently ironed out as special circumstances come to light, such as conditions at camps, farmers markets, boarding schools, special religious services and cultural activities etc… In response to these strategies, as can be seen in the graphs at the end of this narrative, California is seeing fewer new cases and the case fatality rate is nearly flat, suggesting that the number of people being tested relative to the number succumbing to COVID-19 illness is currently stable. Ongoing diligence must be practiced to maintain the downward trend in weekly fatalities, particularly as counties move to the lower-risk tiers and continue a slow and deliberate return to normalcy.
Resurgence of COVID-19 appears to be occurring in the U.S. midwest and Europe at present as the virus finds susceptible populations and avenues of spread. Even as vaccine trials for several vaccine candidates enter their last stages before being commercially released, it should be noted that adhering to the recommended social distancing, hand washing and masking guidelines will lower the percentage of the population that must be immunized in order to halt the spread of the virus. In other words, these protective measures must continue to be practiced even as vaccines become available over the next six months to a year. This will allow a more rapid return to normalcy and allow businesses to more quickly begin the process of recovery that has taken such a toll on the populations of the world.
As we approach a critical U.S. election on November 3, it seems worth considering how we might use the tragedy of the COVID-19 pandemic as a learning experience and consider which government leaders are more prepared to be introspective about the lessons of the pandemic to repair and strengthen the public health infrastructure of our country. Americans have never, in my mind, pretended to be free of historical mistakes. However, there is reason for American pride in our willingness to publicly scrutinize our mistakes and correct or improve our performance through the tools made available in the U.S. Constitution. And voting is certainly one of the most important of those tools.
September 11, 2020
Years ago my daughter sent me the following chart that I stumbled across while cleaning up some files during a power outage over the past three days. Thanks to OurWorldinData (and my daughter) for the chart.
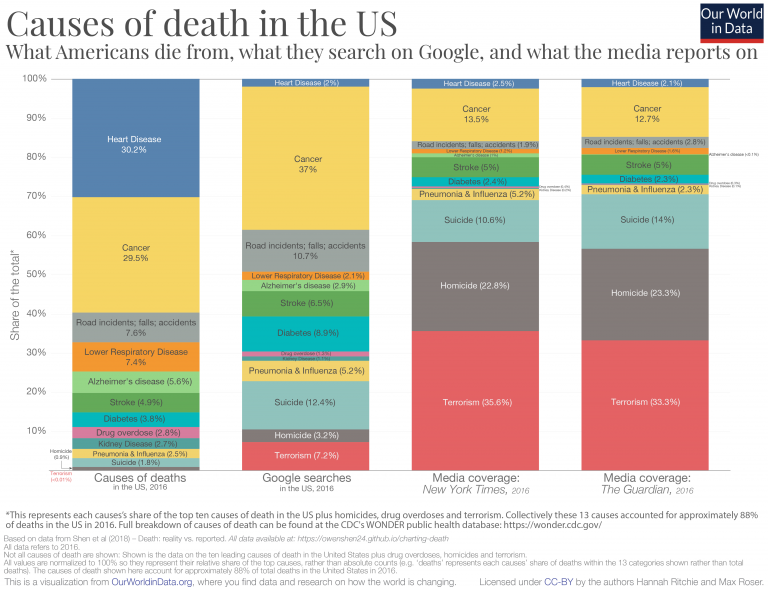
Understanding the tenuous scaffolding of truth that underlies our perceptions of reality is critical if we are to avoid meandering off into a Midsummer Nights Dream. We are being bombarded with challenges here in September 2020, from wildfires that are becoming a regular seasonal event here in California, to a president who freely manipulates truth to suit his own interests, to a pandemic that continues to disrupt any sense of normalcy and a public that is suffering the consequences of deplorably low levels of public health literacy. But it is worth remembering that there is a truth out there, and where there is a truth there is a solution. This is just a toast to all those whose lives are dedicated to seeking the truth, from scientists to parents, from teachers to soldiers and from journalists to politicians.
August 28, 2020
Several odd developments have arisen since the last entry into this narrative. First, there has been an ongoing and often bitter debate across the country about the reopening of schools. Secondly, the CDC, our most respected national experts and advocates for public health, quietly modified recommendations for COVID-19 testing to indicate that asymptomatic exposed individuals who “…have been in close contact (within 6 feet) of a person with a COVID-19 infection for at least 15 minutes but do not have symptoms… do not necessarily need a test unless you are a vulnerable individual or your health care provider or State or local public health officials recommend you take one.” This new recommendation is in contrast to the previous recommendation that advised asymptomatic exposed individuals to seek testing so that contact tracing could be accomplished by public health authorities. No scientific citations were identified for this new recommendation and there are indications that the change came through political channels (https://www.cidrap.umn.edu/news-perspective/2020/08/experts-question-cdc-changes-covid-19-testing-guidance, https://www.nytimes.com/2020/08/26/us/politics/coronavirus-testing-trump-cdc.html)
The science indicates that reopening of schools is an important goal to pursue, but that it must be done – and CAN be done – in partnership with public health guidance and by using a deliberate set of metrics to determine when and to what extent in a given community it is safe to do so (https://ethics.harvard.edu/educational-ethics-pandemic, https://www.nejm.org/doi/pdf/10.1056/NEJMms2024920?articleTools=true, https://globalhealth.harvard.edu/path-to-zero-schools-achieving-pandemic-resilient-teaching-and-learning-spaces/). Our teachers are one of our most important models for responsible behavior and respect of science, so their coordination with our scientific community is critical. Our most important endeavor MUST be to avoid debates in which the science is left behind and encourage debates with science at the center, because ignoring science places our educational system, our children and our communities at risk not only of COVID-19 outbreaks, but also opens the door to ideological extremism which can propel us towards any number of destructive outcomes.
If one should question whether unscientific, self-interested political pressure from the highest levels of leadership can influence communications from our most respected public safety institutions, one only needs to look at the updated CDC guidance. No justification for the new recommendations have yet been shared by the medical, scientific and public health experts at the CDC, leading one to conclude that indeed this quietly released new guidance was initiated by those outside the scientific community. Such recommendations undermine the data that our public health champions use to steer the ship during this pandemic, destroy public confidence in science, and are likely to further interfere with our ability to safely open schools by negatively affecting our disease prevalence in communities across the country.
A glimse at the chart entitled California Coronavirus Observed Case Fatality Rate Monitoring.8.27.20 at the end of this narrative will indicate that the 24-hr case fatality rate has risen for the statewide numbers, suggesting that the state continues to under-identify cases of COVID-19 relative to the numbers that would be expected based upon the number of deaths occurring across the state (considering that an actual case fatality rate should linger in the range of 0.5 to 1%) and that this situation is potentially worsening. Simply stated, if exposed at-risk individuals fail to be tested/identified, asymptomatic infected people will continue to spread the virus and the risk to students attending schools in-person will increase, leading to school closures after reopening or delaying reopening altogether.
August 5, 2020
A drop in coronavirus lab testing across the nation of 3.6% was noted by the New York Times today. This trend likely contributes to the increase in Apparent Case Fatality Rate that can be seen in the monitoring graphs at the end of this narrative both in California and in the nation, because as fewer cases are recognized by screening asymptomatic and presymptomatic high risk subpopulations the denominator decreases and the observed fatality rate rises. It is important that people continue to adhere to physical distancing and wearing of masks when distancing is not feasible, avoid gatherings, and obtain a swab test if you think you may have been exposed. Also, be sure to have your test done by a highly reliable laboratory supported by your local health department, as there are a number of quickly developed screening tests from small commercial labs that are showing poor correlation with the gold standard PCR test.
July 25, 2020
The trends discussed in the previous entry to this narrative have continued, although the data for California is more strongly indicating increased transmission of SARS-CoV-2, the COVID-19 virus, throughout the state. In the graphs that follow this narrative for July 24, note the increased numbers of deaths in the prior 24 hours for Caifornia and the slightly higher Apparent Case Fatality Rate in Prior 24hrs for Caifornia. Of greatest concern in light of these figures is, of course, the level at which the California population is adhering to the physical distancing and protective measures that are known and have been proven to be effective in controlling the COVID-19 pandemic across the country and the world, measures which have been listed in these narratives multiple times and will not be repeated today.
The higher Apparent Case Fatality Rate in Prior 24hrs data (despite the earlier identified shortcomings) in the graphs suggest a higher case rate (the denominator) than identified by confirmationary lab testing in the population and is a measure of some combination of the following factors: 1) the high asymptomatic and presymptomatic infection rate preventing people from considering the possibility that they are infected, 2) local capacity for convenient lab testing, 3) access to and/or funding for lab testing, 4) the willingness of the population to be tested, 5) a more vulnerable population being infected, 6) a more aggresive strain of the SARS-CoV-2 evolving and circulating, 7) an environment (weather, travel patterns, demographics etc…) more conducive to transmission and poor outcome, including a higher proportion of the population being non-immune to the virus, 8) an overwhelmed and/or less than optimal in-patient care for infected patients. It is worth emphasizing that any of these factors may in fact be having a negligible effect, but need to be considered as we address the problem. The higher relative number of unidentified infections, of course, can be predicted to result in a hobbled public health response, limiting opportunities for contact tracing.
Consequently, and as mentioned in the first paragraph very likely related to a less than optimal public adherence to recommended public health recommendations, California is seeing a significant increase in death rates due to COVID-19. As a result, the system of designating counties for restrictions and targeted monitoring now includes 35 counties. This list is based upon a number of outbreak indictors which include performing 150 tests per 100,000 residents, confirming more than 100 COVID-19 cases per 100,000 residents over the past 14 days, having more than 25 cases per 100,000 AND an 8% positivity rate in COVID-19 testing, a 10% or greater increase in COVID-19 hospitalizations in 3 days, fewer than 20% of ICU beds available or fewer than 25% of ventilators available (see https://www.cdph.ca.gov/Programs/CID/DCDC/Pages/COVID-19/COVID19CountyDataTable.aspx). The following language, in italics, is directy from the California state website:
Effective July 13, 2020, ALL counties must close indoor operations in these sectors:
- Dine-in restaurants
- Wineries and tasting rooms
- Movie theaters
- Family entertainment centers (for example: bowling alleys, miniature golf, batting cages and arcades)
- Zoos and museums
- Cardrooms
Additionally, bars, brewpubs, breweries, pubs must close all operations both indoor and outdoor statewide, unless they are offering sit-down, outdoor dine-in meals. Alcohol can only be sold in the same transaction as a meal.
Counties that have remained on the County Monitoring List for 3 consecutive days will be required to shut down the following industries or activities unless they can be modified to operate outside or by pick-up.
- Gyms and fitness centers
- Places of worship and cultural ceremonies, like weddings and funerals
- Offices for non-critical infrastructure sectors
- Personal care services, like nail salons and body waxing
- Hair salons and barbershops
- Shopping malls
Shops that offer tattoos, piercings and electrolysis may not be operated outdoors and must close.
One additional county has been listed but awaits the determination whether the three-day trigger has been reached for the additional closures as described in the state directive above. The list of counties on the Monitoring List can be reviewed here: https://covid19.ca.gov/roadmap-counties/
Near the top of the list for county planning are decisions about school openings and procedures for Distance Learning (home-based lessons provided through a carefully designed internet network of students and teachers). Even counties where schools are tentatively planning to open for physical attendance will need to have backup plans in place for Distance Learning in the event of outbreaks occurring on campus. Guidance from the American Academy of Pediatrics released in June advocated strongly “that all policy considerations for the coming school year should start with a goal of having students physically present in school.” At the same time, this guidance states that “school policies must be flexible and nimble in responding to new information, and administrators must be willing to refine approaches when specific policies are not working” and goes on to say that “it is critically important to develop strategies that can be revised and adapted depending on the level of viral transmission in the school.” Now is the time for these policies to be discussed and developed by school systems throughout the state, with leadership from and partnership between the California Department of Education and the California Department of Public Health.
July 9, 2020
Interpreting the data in the graphs at the end of this narrative periodically is perhaps the most helpful contribution of this website exercise. Setting aside the fog of statistical artifact and the influence of potential changes in clinical care (such as the use and availability of experimental medications like remdesivir), this physician would submit the following interpretations: 1) There is a subtle increase in the confirmed COVID-19 death rates since the end of June, suggesting an actual increase in case numbers (ie. true spread of disease). 2) A distinct increase in confirmed cases both in the U.S. and in California was followed about two weeks later by an increase in deaths, suggesting an association between these two trends. 3) A considerable portion of the increase in new cases can be attributed to much more thorough laboratory testing of the population, based upon the apparent daily case fatality rates approaching an accurate daily case fatality rate (which is referred to by epidemiologists as the “infection fatality rate”). We can speculate that increased testing is significantly a result of improved access to and public interest in SARS-CoV-2/COVID-19 laboratory screening. Additionally, more thorough population screening is presumably associated with increased contact tracing by local and regional public health authorities, since postive results are strictly reported to these public health systems. This work remains the most effective means available to curtail the spread of disease, in conjunction with public adherence to physical distancing, masking, handwashing and other public health recommendations.
July 2, 2020
The data graphs at the end of this narrative have been updated and our data source has corrected the errors in the data they were distributing over the last two days. Periodically, changes occur in how states report data and what definition of “confirmed cases” are being applied in the reporting. For longitudinal analysis of this data it is critical that a consistent approach be applied, or at least that qualifying language is used to explain such changes. The trends that have been discussed are essentially unchanged by the data malady of the past 48 hours. The data is now internally consistent.
July 1, 2020
For reasons that are unclear this morning, errors have been identified in the COVID-19 data we have been monitoring each day with the graphs at the end of this narrative. Until the source of the error can be identified by the data dashboard upon which we have been relying, the charts being shared today are from June 28, at which point the data was internally verified as being accurate. When data inconsistencies are corrected, the graphs will be updated.
June 26, 2020
The monitoring graphs at the end of this narrative show a very concerning peak today. It is striking that the debate about whether COVID-19 death rates vs. disease incidence rates are most helpful in monitoring disease spread has now hit the media and messaging from the White House. As has been the perspective expressed repeatedly in these narrative updates, it is the juxtaposition of both data streams that provides the most insight into the spread of the disease and a measure of the adequacy of the public heath response. Remember that it is disease surveillance (testing of suspected cases and high risk personnel) that allows us to trace contacts, institute quarantines and prevent further spread. This is our primary tool against the pandemic. To suggest eliminating testing for SARS-CoV-2 (the COVID-19 virus) is foolish at best. When such a plan is promoted for political reasons, the policy must be considered malicious.
One of the concens about relying too heavily only on COVID-19 death rates relates to the delay between disease onset and death in victims of the outbreak. It can be expected that there will be a delay of perhaps two weeks between a rise in disease incidence and a subsequent rise in deaths, subject in part to the many variables that have been discussed in these narratives, not the least of which is the vulnerability of the population being infected. For instance, disease spread among a younger, healthier population might be expected to result in a lower case fatality rate in the overall population data. However, such a trend would be expected to be only temporary, as disease prevalence will ultimately spill over into the more vulnerable populations.
On the other hand, we must remember that a successful pandemic response would be expected to increase apparent disease incidence as more cases are accurately identified in the popuation, with the corollary that the daily case fatality rate would be expected to move closer to the expected case fatality rate somewhere below 1%. This would again involve some delay between data collection and reporting. This trend towards a 1% apparent case fatality rate would be expected as a robust public health response unfolds.
With this said, todays Johns Hopkins data show a spike in both the rate of disease, numbers of deaths, and case fatality rates for the U.S., suggesting that a real increase in disease incidence is occuring across the country. Interestingly, this trend is not clear in the California data, where efforts continue to promote physical/social distancing measures and the wearing of masks. Unfortunately, adherence to state guidelines, even in California, has been widely variable in different regions, both among the population, among law enforcement, and among local government leadership. Watching these numbers and supporting public health recommendations will be critical over the next weeks in order to minimize illness and death rates for the most vulnerable among us.
June 23, 2020
Data continues to be analyzed as the world slowly advances through the stages of demobilization and haltingly lifts recommended restrictions on physical/social distancing. In many cases, countries have reinitiated shelter-in-place recommendations due to increasing incidence of COVID-19 diagnoses in cities, regions, states or in entire nations (e.g. South Korea, China, Arizona, France). The term “second wave” of infection is commonmly being used, but the extent to which increasing incidence of disease in populations is a bias introduced by improved screening for disease, as has been regularly contemplated in the narratives here with some degree of head-scratchng, is now being debated. Unfortunately, this valid statistical question is being used by some to manipulate a self-serving message, such as suggesting that all increased incidence of disease can be explained by improved laboratory testing. Apallingly, some have even suggested that because of this, rising incidence of infection should be remedied by performing less testing of the population! There is no question that such a bafflingly ignorant proposal would lead to greater spread of disease.
In the graphs at the end of these narratives, a new depiction of the U.S. COVID-19 Apparent Case Fatality Rate in the Prior 24hrs has been added. This allows the incidence of disease (the number of newly confirmed cases in the prior 24hrs, i.e. the denominator) and the daily COVID-19 death rate (i.e. the numerator) to be a better reflection of daily fluctuations. In this way, a falling daily Apparent Case Fatality Rate suggests that screening for disease (and therefore, case investigations, contact tracing, and isolation/quarantine which are our main secondary and tertiary tools for control of the outbreak) is being accomplished, at least insofar as the number approaches something below 1%. At the same time, a rising number of daily fatalities may alert public health responders to an otherwise unrecognized increase in disease incidence (e.g. a “second wave”), and should be analyzed for any of the other factors (and note that there are quite a number of them) described in the narrative below that might contribute to such a new trend. In the graphs there can be arguments made that we are now seeing both an improved rate of screening for disease in the U.S. population, an overall decrease in disease incidence over the past six weeks, but also a slight increase in incidence in the past ten days or so, probably reflecting the lifting of some restrictions in some states and a consequential boost in the spread of disease.
Moral of the story: continue to follow good hygeine, physical distancing and masking recommendations.
June 6, 2020
An interesting news report in the journal Nature (Vol 581/Issue 7806 May 7, 2020) is entitled ‘Whose Coronsvirus Strategy Worked Best? Scientists Hunt Most Effective Policies.” In it are several graphs portraying the stringency of a country’s response to the coronavirus outbreak juxtaposed with the total number of confirmed deaths (not deaths per capita). In the current political whirlwinds surrounding the reporting of coronavirus pandemic data, one must first understand, as we have emphasized in these narratives, that the data reported by various countries may unfortunately have large disparities in accuracy due to political influence and/or capacity for screening and data reporting. That said, the referenced news report describes how computer models and machine learning technology are being applied to the statistics to determine which strategies have been most effective in diminishing the impact of the pandemic on populations.
In the context of the simulataneous protesting of racial injustice that is now happening, the graphs in the Nature article highlight another point for contemplation. The human desire for freedom – recognizing that we each have our own personal concept of what “freedom” means – is uncompromising and elemental. The sacrifices that people are willing to make to achieve and sustain freedom are extraordinary and sometimes widely visible, like the current widespread protests. But those sacrifices are perhaps even more often invisible. In the context of the coronavirus pandemic it is interesting to note that countries with greater restrictions on personal freedoms were able to impose earlier and more stringent restrictions (e.g. limiting travel, school and business closures, stay-at-home orders, mask requirements etc…) on their citizens than countries like the U.S. where personal freedom is a foundational value for which we strive. It will take years of study to identify which imposed restrictions were effective or ineffective in limiting disease spread. One less visible cost of freedom in the U.S. is limited control over public compliance with recommended strategies to restrict pandemic disease. Another cost of freedom (of the press) is vulnerability to misinformation disseminated for self-serving, political or nefarious purposes. It is worth considering that education is one of the most potent antidotes to the formidable risks raised by our worthy desire for personal freedom and equitability. Education in the cause of public health literacy is critical to any country’s success, but even more so when personal freedom is a foundation for society.
May 23, 2020 (updated May 24)
The Journal of the American Medical Association published a research letter from the Los Angeles Department of Public Health and the University of Southern California on May 18 that describes the prevalence of SARS-CoV-2 (COVID-19) antibodies in a sample population of over 860 residents of an LA neighborhood. After weighted adjustments of the data, approximately 4.3% of the population tested positive for the antibody. For those of you with the curiosity of an epidemiologist, presence of the antibody identifies people with evidence of recent or active infection with the virus, with a test sensitivity of 82.7% (95% CI, 76.0%-88.4%) and specificity of 99.5% (95% CI, 99.2%-99.7%). A particularly interesting part of the research project included the fact that approximately twice as many of the total subjects had mild symptoms attributable to COVID-19 at sometime over the prior two months than tested positive, although these distinct populations do not account for people who remained completely asymptomatic. Because this would have been at a time when influenza was continuing to circulate, it will be interesting to see how often symptomatic people test positive over the next few months, since this limited study reminds us that mild symptoms may well represent illnesses other than COVID-19. Remember that asymptomatic transmission of the virus remains one of its most treacherous characteristics, in combination with its fatality rate.
As can be seen in the graph at the end of this narrative, the good news is that actual numbers of daily deaths are indeed declining, which surely represents a decrease in disease transmissions. While access to testing continues to increase, most parts of California, the U.S. and the world remain far behind in testing capacity and implementation.
May 13, 2020
Data is being monitored to assess whether clusters of COVID-19 are emerging in those parts of the world and the U.S. where shelter-in-place orders are being lifted. As noted earlier in this narrative, this data is only as good as confirmatory lab screening and syndromic surveillance is being dilligently conducted. With that understanding, it does appear that new clusters of infection have occurred in communities in Wuhan, China, South Korea and Germany since social distancing measures were loosened. Daily COVID-19 confirmed death rates (not apparent case fatality rates) across the U.S. have slowly decreased (see new chart at the end of this narrative) since social distancing, shelter in place measures and contact tracing/quarantine practices were implemented in March and April, so it will be important to see how these trends may change as commerce and travel restrictions are eased both nationally and locally. In the new graph depicting reported deaths in the prior 24 hours, note the “noise” created by a weekly periodicity of the figures, reflecting any number of reporting artifacts in the data. While a general downward trend can be seen in the numbers of daily deaths, this “noise” may make early recognition of new disease clusters difficult to recognize. Nevertheless, experts in partnership with local health care facilities and caregivers will be analyzing this type of data with elegant filters to recognize any worrisome clusters of infection as early as possible while social activities are cautiously being resumed, hopefully in conjunction with Public Health recommendations.
Finally, as has been regularly mentioned in news and government press conferences, we must treat the epidemiologic data with respect, recognizing that this data does not just represent a list of numbers. Each number represents potential illnesses or fatalities with tragic consequences for families and patients.
May 5, 2020
As we continue to monitor the COVID-19 apparent case fatality rates in the U.S. and California, models are predicting that the ultimate number of deaths in the U.S. will likely approach 130,000 before the pandemic slows considerably. This insight is, of course, accompanied by a reminder that the outbreak and the behavior of this virus is being analyzed as its spread unfolds, so additional revisions are almost certain. However, because our calculations of the so-called “Apparent Case Fatality Rates” use overall historical surveillance data, it is no longer meaningful to include an “Expected Fatality Rate” line on the graphs that accompany this narrative. This is because our calculated apparent case fatality rates are skewed by historically limited surveillance data during the first eight weeks of the outbreak in the U.S., preventing an outbreak-wide calculation from ever being expected to approach the true fatality rate. For this reason, the Expected Fatality Rate target line on the accompanying graphs has been removed. Even so, it is worth remembering that a true fatality rate from COVID-19 virus in the general population (again, noting that fatality rates vary greatly between populations of different ages, racial groups, underlying degrees of wellness/comorbidities and access to care) appears to be somewhere under 1%.
Perhaps more importantly, new cases of COVID-19 continue to be registered at a rate that has been essentially constant for the past six weeks, so protective precautions should remain a part of each persons daily routine, particularly as shelter-in-place requirements are being lifted.
An important updated article was released today by the journal, Emerging Infectious Diseases, that underlines this last message. This article further describes our limited understanding of asymptomatic and presymptomatic transmission of SARS-CoV-2 (the COVID-19 virus) and highlights the importance of understanding whether infection confers protective immunity.
April 30, 2020
Several interesting trends are worth considering as we continue to follow the COVID-19 data being collected and charted by the Center for Systems Science and Engineering at Johns Hopins University and registered in graphs that accompany this narrative. First, by comparing the two graphs at the end of this narrative one can see that the “U.S. Apparent Case Fatality Rate” is almost 6%, while California is one example of a state with an apparent case fatality rate that appears to be currently leveling out at about 4%. Two important precautions that should be quickly mentioned, including first that this data is subject to a number of large biases as noted in the original narrative from March 19, and second that we cannot predict what the extended trends will reveal over the next weeks and months. That said, it will be interesting to see how the implementation of different plans to demobilize the pandemic response in different states and counties will affect these numbers. This data is destined to be analyzed and studied for decades into the future in an effort to prepare for an inevitable “next” epidemic, so considering how we might direct our efforts today to maximize the insights gained in the future is a good use of our head-scratching.
How will a community be able to know, as early as possible, if the measures being employed locally are sufficient to minimize illness and mortality due to SARS-CoV-2 as we re-establish local business and social activity? The most important factor will be surveillance for COVID-19 illness. This consists of information collected throughout a community that corresponds to the incidence of illness like COVID-19. Examples might include data about school attendance (not practical at this time because schools in most parts of the country remain closed), sentinal providers (a “biopsy” of sorts, using a sample of local health care providers to report all clinical presentations during a period of time to determine if the complaints might be due to COVID-19), and utilization of specific resources. Such resources as Google searches, purchases of pharmaceuticals or health insurance utilization have been used in the past to monitor disease trends, but these are often not very reliable proxies for the direct measurement of disease.
One of the most accurate measures of disease incidence is accomplished by what is called “syndromic surveillance.” The burden of syndromic surveillance falls upon the local health care system, primarily hospitals, emergency rooms and urgent care centers. It will be critical that U.S. hospitals partner closely with their local Public Heath Departments to keep public health officials (and therefore, local government leaders) appraised of illness trends collected through the assignment of “ICD-10” codes. “ICD” stands for the International Classification of Diseases and represents the diagnosis assigned to patients in a health care system. If an increase in COVID-19 illness occurs in a community we can expect an increase in visitations for the urgent care of respiratory diseases, and unfortunately, eventually an increase in local fatalities due to respiratory illness. Of course, these patients must be tested for the COVID-19 virus in order for the system to detect the local increase, so a continued effort to expand COVID-19 testing capabilities is essential.
We must also consider the fact that COVID-19 infection occurs without any symptoms in up to 80% of cases. Therefore, another important method that regions must utilize to detect COVID-19 illness is laboratory screening of people at risk of illness, regardless of the presence or absence of symptoms. The thoroughness of this testing should be well reflected in the number we have referred to here as the “Apparent Case Fatality Rate,” because there will remain a relatively fixed true mortaity rate from infection (dependent, again, upon a number of local risk factors) that can be used in the Apparent Case Fatality ratio to measure the efficiency of population screening.
The message of these ruminations is, as we enter this next phase of the COVID-19 pandemic, that careful consideration of the science of epidemiology and adherence to the recommendations of public health officials is critical to our efforts. Lacking this information is like embarking on a hike into the widerness without a map, compass or, in todays world, a GPS. We will inevitably learn how different policies and protocols used in different parts of the country and state, adopted under the influence of a wide spectrum of political and social convictions, will impact the health of local residents in different regions. Through the astute application of the principles of disease surveillance we will eventually know which policies resulted in the least amount of suffering, illness and death. Our leaders should remain strictly attentive to these principles as they navigate this hike through the widerness.
April 19, 2020
Some encouraging data is beginning to gather, as apparent in the graphs at the end of this narrative. However, it remains important that commerce and social interactions continue to follow the guidance of public health experts as we build strategies for a stepwise and deliberate return to the routine services and activities of our communities.
April 18, 2020
As noted in the blurb below from April 13, protest from business owners and members of the public against shelter-in-place requirements from public health experts is predictably continuing to rise. Some leaders are relying upon the scientific evidence in their deliberations, public comments and long-term planning as they strategize how to reopen segments of the economy and other leaders are not. In the graphs at the end of this narrative stream (recognizing a delay in the collection of the data by the Johns Hopkins University Center for Science and Engineering and listing of the data in the tracking system) it is easy to see that screening for COVID-19 illness in our communities is not yet keeping up with the diagnosis of the disease in cases resulting in fatal outcomes. This is evident from the fact that the apparent case fatality rate continues to rise. In addition, the scope of the unrecognized prevalence of the disease in our communities is emphasized by a non-peer reviewed study just released in pre-print form by Stanford University in which antibody testing was done on a sample of 3300 residents of Santa Clara county to determine how many had recently been exposed to the COVID-19 virus. The study concluded that the “seroprevalence” (the percent of the population that tested positive for antibodies to the virus) was 1.5%, suggesting that there had been “50-85-fold more (cases in the population) than the number of confirmed cases.” As a result, physicians are appealing for a cautious consideration of risks of further spread of infection as we slowly and deliberately reopen certain segments of the economy. We owe a good deal of gratitude to businesses – particularly the smaller businesses with narrower profit margins – that are making enormous sacrifices during this crisis, as well as gratitude to the heath care workers on the front lines – from emergency services personnel to inpatient care-givers and countless others in laboratories behind the scenes – for the risks they are accepting as they directly confront the challenges of this pandemic. But this is not the time for a wholesale return to business as usual. Deliberate planning with science as our compass, as outlined by Governor Newsom, is a critical part of the entire public health response as we move forward.
April 14, 2020
Yesterday New York City increased the count of deaths by 3700 as a result of including recent deaths that have occurred in patients who were never tested for the COVID-19 virus but were presumed to have been infected by it at the time of death. Such early adjustments of epidemiologic data are not unusual due to limited capacity to diagnose and chart data during the early phases of any outbreak. As the infectious syndrome criteria are more clearly defined and the prevelance of the disease increases during an outbreak, cases can be categorized with more certainty and the reported numbers adjusted accordingly. Because of this correction in the data, the graphs that accompany this narrative will show a bump. These kinds of corrections add more relevance to the message that we must hold the course until a clear map of the outbreak can guide us through our careful return to normal daily life.
April 13, 2020
As we enter the fifth week of lockdown measures to restrict the opportunities for the SARS-CoV-2 to spread, the patience of legislators and the public appears to be wearing thin. There are enormous burdens being borne by business owners – particularly small businesses with narrow margins and limited reserves – as consumer spending has plummeted. However, these burdens must be weighed against the risks of increasing infection rates and hospitalizations if careful quarantine restrictions and contact tracing efforts recede too soon and too quickly. Through a process called “demobilization,” public health measures implemented to mitigate epidemics are contracted after careful planning in a stepwise manner to assure the least impact on costs, including economic, health system and personal/public/family health costs. Doing so successfully requires analysis of the organism in question and, if possible, a look at how other regions of the world fared after responding to the wave of the outbreak. As you can see from the monitoring graphs at the end of this narrative, we are just beginning to see some suggested light on the horizon, but it is important to listen to the advice of public heath, infectious disease and medical experts before insisting on returning to activities that pose an unnecessary risk to ourselves and to others. Our capacity to manage an accelerated impact from this virus remains very limited.
April 11, 2020
A look at the trend graphs at the end of this narrative gives a first suggestion that the incidence and apparent case fatality curves for the COVID-19 pandemic in the U.S. and California are flattening, but this suggestion should be taken with an enormous grain of salt. Today is Easter Sunday for many Americans and this holiday may have influenced data collection and any other number of factors required for collecting and monitoring this data. Nevertheless, an optimistic message seems worthwhile during this spring season.
April 10, 2020
As we monitor the epidemiologic data being reported from states across the country, the variations in case numbers over time and fatality rates between different states and regions provide important insights into the strengths and weaknesses of our health care industry. As has been said many times by many experts, our health care industry does not clearly qualify as a “system” because it is fractured into a private industry with powerful economic incentives and a public system that includes a safety net that intends to assure a certain standard of care for a population uncovered by health insurance or other resources, as limited by legislative investments and the commitments of our political leaders. The importance of the complex network we call a “safety net” is being highlighted by the COVID-19 pandemic, as the SARS-CoV-2 virus does not respect the differences between the insured, the uninsured and the so-called “medically indigent.” A reservoir of Americans with a disproportionate shortage of resources like shelter, food, education and general health is disadvantaged against the challenges of the current pandemic, providing fertile ground for persistent spread of the virus. Moreover, this population is less visible than we might normally appreciate, as the weight of public health illiteracy crosses all social strata. The insights that the current pandemic data provides into gaps in our health security as a nation will be studied for decades to come, and will hopefully lead to attention to shortcomings in our health industry, leading us to develop a more robust health care system. With an emphasis on the word, “care.”
April 9, 2020
The April 2, 2020 edition of the scientific journal, Nature, included an article addressing the epidemiologic analysis of data being collected from public health sources around the world and on cruise ships. The article referenced research (T.W. Russell et al. Preprint at medRxivhttp://doi.org/dqrk;2020), raising questions about the comparison between “case fatality rates” (what STS Studios has referenced as “apparent case fatality rates,” based upon the limited surveillance of asymptomatic or mildly symptomatic COVID-19 cases and deaths that are not screened for the COVID-19 virus and are therefore not counted. Overall, these biases cause an artificial increase in the calculated fatality rate (as noted in the original discussion from March 26, below) relative to “infection fatality rates” (the rate of deaths among infected people in a population if you accurately identified all infected patients in the population, and therefore had a reliable denominator). Using data from cruise ships, where nearly all passengers were screened for the COVID-19 disease, the actual fatality rate for the disease may be even less than 1%. In the data charts we have been monitoring and posting at the end of this narrative we identify an “expected fatality rate” as 1%, just to give some sense for how accurately the available data reflects the prevalence of disease.
April 7, 2020
Disproportionate COVID-19 fatality rates in different parts of the country raise a number of questions regarding access to care, baseline health of populations, racial factors affecting healthcare decisions and consistent application of laboratory testing recommendations. African Americans in Chicago were found to have a significantly higher fatality rate than other Chicago racial groups.
A CDC study was released with a first look at the sensitivity (ability to detect the disease in people with the disease) and specificity (ability to rule out disease in people who do not have the disease) of new antibody tests to detect whether a person was recently infected with the COVID-19 virus. In these tests, it generally took two weeks after presumed infection for people to develop the antibodies and test positive.
April 4, 2020
The Centers for Disease Control released guidance on the use of “cloth face coverings” after considerable discussion. The statement that was released states, “CDC recommends wearing cloth face coverings in public settings where other social distancing measures are difficult to maintain (e.g., grocery stores and pharmacies), especially in areas of significant community-based transmission.” Such measures are primarily designed to prevent the transmission from the wearer to others when the wearer is infected with or without symptoms. Such a cloth facial covering is not likely to prevent the wearer from being infected from others, but the extent of protection is unclear at this time due to the limited amount of controlled data that is available.
April 3, 2020
The American public remains under variable social distancing restrictions, ranging from complete lockdowns with some degree of local enforcement to the elimination of unnecessary travel outside of the home. Recommendations described below remain the founation of our battle against this pandemic. Some progress is being reported in the phase one testing of new vaccine candidates, but there are four phases of testing that all new vaccines must undergo. Phase one involves a small number of subjects who receive a range of doses to determine which dose is most efficient in achieving the desired antibody response. Phase two involves the administration of the vaccine to a larger population representative of the target population for the vaccine, and phase three expands the testing to a large but restricted population to determine overall safety and effectiveness. Then phase four studies observe the performance of the vaccine in the general target population. This process for the SARS-CoV-2 virus (the COVID-19 virus) is expected to take perhaps a year or more. In the meantime there are studies of other agents to determine whether they may improve survival, but there are currently no medications shown to be effective against COVID-19 in controlled studies that I have been able to find in current research. Therefore, treatment and prevention options should always be discussed with individual health care providers and public health experts based upon individual risk before being implemented.
March 19, 2020 (Updated March 26, May 10, 2020 and October, 2020)
STS Studios is a place where we create new public health messaging materials and generally have a good time sharing the science of public health. Usually, our content is designed for young folks, because our sense of humor is aimed at the child within us. However, the current COVID-19 pandemic calls for some serious sharing of information to prevent a public unfamiliar with public health principles from slipping into despair as we shelter in place and apply social distancing measures. So here are my thoughts – for what they are worth – as a physician who ran a private family practice for twenty years, served as health officer in a rural California county for twelve years, worked overseas in Ebola clinical care and stateside with Zika planning and had the benefit of working in communicable disease at the state and national level with colleagues in public health leadership. And who is now retired from clinical medicine…
In order to accurately predict what we might expect from this coronavirus pandemic we need information. Accurate information. We must understand many elusive details about this newly evolved virus, formally named “SARS-CoV-2” that causes the clinical condition, “COVID-19.” In this piece I will refer to the organism as the COVID-19 virus, because this has become the convention in the media.
This may be a good time to remind people of the difference between a virus and a bacterium. The germ that causes COVID-19 is a virus. A virus lacks a cell membrane and the self-contained machinery that makes a cell a cell (although viruses can have an envelope or capsule which may protect it from a hostile environment). A virus is basically just a segment of RNA or DNA (SARS-CoV-2 is an RNA virus) that is capable of reproducing itself by depending on the machinery of our own cells. As such, there are fewer targets in viruses than in bacteria for pharmaceutical weapons like antibiotics to hit. This is why we have fewer antiviral medications than we do antibacterial medications.
The illness is a lower respiratory infection. Perhaps 80% of patients have minimal or no symptoms, but in the elderly and people in poor health the infection can lead to a type of pneumonia which can progress to respiratory failure and possibly death. The fatality rate in the general population according to current data is about 1%. As new treatments are explored and hospital resources expanded, we may see improvements in this 1% fatality rate. Remember that this fatality rate is different for different populations depending upon general health, age and co-conditions. Unfortunately, we can expect other factors like access to health care, mental health, education and socioeconomic conditions also to influence fatality rates.
Because no effective antiviral treatment is currently available, our best strategy is to slow spread of the virus by preventing transmission between people by measures called “Social Distancing.” In the age of ubiquitous social media, it is important to stay socially connected with those who may rely upon their tenuous social connections, like the elderly and the disabled, so some prefer to replace the term “social distancing” with “physical distancing.” Physical distancing will buy time for newer and more specific interventions to be developed. Because this virus is transmitted by droplets that are created by coughing and sneezing, a distance of 6 feet from other people is recommended. A common surgical mask can help prevent an infected person from spewing droplets that could infect other people. In addition, research in the summer of 2020 has indicated that there may be a benefit for the wearer of masks in certain infectious diseases like COVID-9 that are transmitted by droplets. To protect a person from receiving an infectious mist from an infected person who is coughing, health care providers must wear an “N-95 respirator,” which is a mask that is designed to limit the transmission of 95% of the tiny aerosol droplets (0.3 microns in diameter) to the wearer. But to work, such a mask must be tested to assure a proper seal. So again, physical distancing is still important.
Other important measures have been recommended over and over and over through every possible media source. That is because: 1) these recommendations are helpful, and 2) we lack alternatives. I would be unable to defend ignoring these basic recommendations here, so with no apology here are those recommendations one more time:
- Wear a cloth mask (or surgical mask) whenever you are indoors in a public place or whenever you are outdoors and cannot consistently maintain a 6 foot distance from others.
- Wash you hands with soap and water regularly for 20 seconds. If soap and water is not readily available and you have contacted a public area, you may use a 60% to 80% alcohol-based antiseptic/sanitizer, but exposure to the alcohol gel should last at least 15 seconds.
- Cover coughs and sneezes by directing them into the bend of your elbow.
- For the time being, do not shake hands during greetings. The “elbow touch” is a reasonable option when a simple hello is insufficient.
- Avoid touching your face – especially the “T-Zone” including eyes, nose and mouth.
- Shelter in place for areas where it is recommended by public health and government leaders. In areas where specific shelter-in-place recommendations have not been extended, avoid public gatherings.
- Maintain the 6-foot distance from others if you must be in public and whenever possible.
- Stay home from work if you are ill. This, with supervisor notification, also goes for medical workers and critical service providers.
- Call your health provider if you have a lower respiratory illness (fever, sore throat, cough, headache, shortness of breath etc…) before going to your health care provider’s office. Upper respiratory illnesses (sinusitis, stuffy nose, sore throat) are less suggestive of COVID-19, but remember that co-infections with more than one virus is possible. A fever is generally considered an oral temperature over 100.4 F°
A vaccine is being fast-tracked, but will probably take a year to undergo the careful process of assuring safety and effectiveness. This should be a lesson to those who have been fearful that vaccines are carelessly released before being well-tested by federal laboratory and public health experts. While vaccines have a range of effectiveness, each vaccine that enters the marketplace must undergo vigorous scrutiny by the Advisory Committee on Immunization Practices (ACIP) and others. The effectiveness of any particular vaccine depends upon many characteristics of the virus or bacteria, such as the “infectious inoculum” (the number of viral particles or bacterial cells required to produce infection), the ability of the vaccine to create an immune response (which is why many vaccines include tiny amounts of components like diphtheria toxoid to induce an inflammatory response) and the complexity of the infectious organism (which is why a vaccine against the malaria parasite has been elusive so far).
Which raises the most important question. What characteristics of the COVID-19 virus must we understand to help us plan a well-considered and effective public health and personal response to the outbreak? The “reproductive number” (AKA “R0” or the number of individuals typically infected by a single index case) is important to understand. The vulnerability of the virus to environmental conditions such as temperature, drying, pH, chlorine, antiseptics and tolerance to the microbiome (the enormous ecological mix of viruses, bacteria, fungi and protozoans that make up a majority of a body’s cellular population) of the human body. Because the COVID-19 virus evidently evolved by hopping from a source animal to humans as it developed a new mutation we can assume that it may infect other animals, but it will be important to know in what animal reservoirs it may continue to survive or cause illness. The duration of infectivity after a person suffers illness will determine how long isolation of patients will be necessary.
This will in part depend upon the viral load (the number of viral particles) in various bodily fluids. One study suggests that the viral particle can be recovered from stool more than two weeks after infection, but whether such a viral particle can induce new infection is unknown. This is an important distinction. Some studies that detect the virus on various surfaces and in the air cannot determine that a detected viral particle is capable of actually causing infection. If you think about it, that sort of reliable study would be impossible to implement due to ethical obstacles facing the design of the study. Other details we would like to clarify include the range of the viral incubation period and infectivity of an asymptomatic infected person.
In addition, predicting the course of the pandemic will depend upon public compliance with quarantine, response to experimental antivirals and laboratory testing capacity to obtain a reliable denominator of symptomatic and asymptomatic patients tested. This is where the expertise of highly trained experts will be critical. The field of epidemiology is devoted to conducting such data analysis. As an example, in the early phases of an epidemic there is a phenomenon known as “discovery bias” which is an over-estimate of disease prevalence when a disproportionate amount of disease is detected when lab testing is directed at specific populations during the initial phase of the pandemic. In the COVID-19 outbreak, there are three numbers that will be helpful to watch.
First is the number of new infections, also know as the “disease incidence.” Note that this information is subject to considerable delay due to the time required for testing to be collected, conducted by the laboratory and results reported. Disease incidence is also heavily subject to influence by how meticulously a particular region is conducting disease screening in both severely ill, minimally ill and in completely asymptomatic people. The second number is, of course, the number of deaths due to the illness. This number is important not only because of the tragic toll taken on the population, but also because a patient death is a clear statistical endpoint. If a region is experiencing a high death rate due to COVID-19 but a low rate of disease detected in the population, there are (in addition to a number of other statistical sampling maladies) four possible primary explanations: 1) the population in question is particularly vulnerable, possibly due to specific sub-populations or regional weather/environmental conditions etc…, (e.g. the experience with the long term care facility in Washington state and the suggestion that higher fatality rates are being experienced by the less affluent and by certain racial groups), and/or 2) the infectious entity has further evolved to become a more aggressive virus strain in certain regions (this possibility is being investigated due to slightly different SARS-CoV-2 strains being recognized on the east and west coasts), and/or 3) critical care of patients with severe respiratory failure is not being optimally managed or delivered in some regions, and/or 4) there is a greater amount of disease in the general U.S. population than been detected by community monitoring of asymptomatic or minimally symptomatic patients in some parts of the country. If the extent of disease in the community is under-recognized, the resulting apparent increase in the case fatality rate is a fallacy but may potentially (and cautiously) be used to gauge the thoroughness of community disease screening. Therefore, the third data point that will be monitored by STS Studios is the apparent case fatality rate (the death rate divided by the apparent disease incidence). On March 26, a fatality rate chart for California is being added and we will update the graphs each day as the pandemic unfolds.
U.S. COVID-19 Epi Curve.3.3.2023
U.S. COVID-19 Observed New Case Reports in Prior 24hrs.3.3.2023
U.S. COVID-19 Deaths and Observed Case Fatality in prior 24hrs.3.3.2023
California Coronavirus Observed Case Fatality Rate Monitoring.3.3.2023
Johns Hopkins Center for Systems Science and Engineering COVID-19 Data Dashboard